Dortmund, 13th July 2026
How are disease-relevant molecules distributed within tissue? And what changes occur even before they become visible under the microscope? Questions such as these are crucial for early diagnosis and targeted treatment in many diseases. Researchers at the Leibniz-Institut für Analytische Wissenschaften – ISAS have, for the first time, succeeded in combining two complementary analytical methods to create a high-resolution molecular map of tissue. Their map makes different biomolecules simultaneously visible and reveals their spatial distribution. The researchers have now published their development and its application, using Fabry disease (a hereditary disease) as a case study, in the journal Analytical Chemistry.
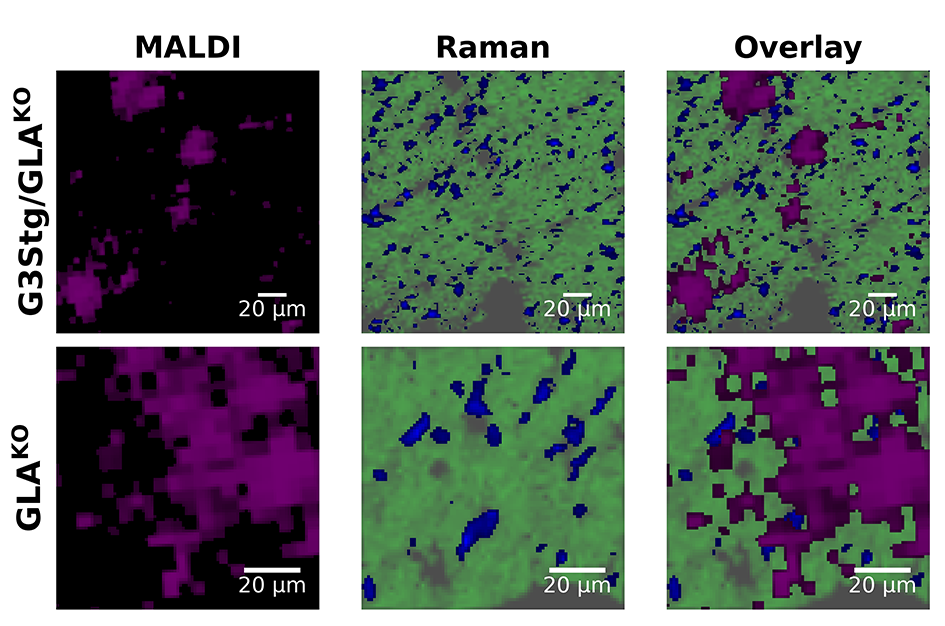
The team combined Raman microscopy with AP-MALDI (Atmospheric-Pressure Matrix-Assisted Laser Desorption/Ionization), including mass spectrometry imaging, AP-MALDI-MSI. Whilst Raman microscopy captures the chemical signature of molecular classes and the structure of tissue in areas with a pixel size of up to two micrometres, AP-MALDI-MSI identifies and localises individual molecules with high accuracy (pixels as small as five micrometres). A specially developed software automatically merged both datasets and spatially aligned them to the same tissue section with micrometre-level precision.
Information for a reliable diagnostic assessment
As an example of application, the researchers examined heart tissue from mice with Fabry disease. In this rare genetic metabolic disorder, certain lipids – globotriaosylceramides (Gb3) – are not broken down sufficiently. Over time, they accumulate in organs such as the heart or kidneys, causing life-threatening damage.
To enable automatic co-registration of the heart tissue images using Raman microscopy and AP-MALDI-MSI, the scientists aligned them with pixel-perfect precision. “Only by combining Raman microscopy with mass spectrometry imaging it is possible to obtain a comprehensive picture of the molecular processes within the tissue. For a reliable diagnostic assessment, it’s important to know exactly where in the tissue Gb3 molecules accumulate,” says Prof. Dr Sven Heiles, Head of the Lipidomics junior research group at ISAS and one of the corresponding authors.
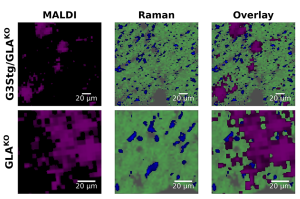
Overlay of images obtained using AP-MALDI-MSI (left) and Raman microscopy (centre) of heart cross-sections from two mice, each with a different severity of Fabry disease: both in the upper and lower sections, there is an accumulation of the lipid molecule globotriaosylceramide (Gb3) in the heart tissue. Purple indicates the distribution of Gb3, green the heart tissue and blue the cell nuclei. The combination of the images (right) reveals exactly where in the tissue Gb3 has accumulated.
© ISAS
Lipid deposits in heart tissue mapped with micrometre precision for the first time
The molecular map revealed that, in Fabry disease, Gb3 is distributed unevenly throughout the heart tissue. Instead, different molecular variants of Gb3 form minute, spatially well-defined accumulations. “The genetic cause of Fabry disease and elevated Gb3 levels in the blood have long been known, andtypical target organs with lipid storage have been described in studies. However, the distribution of lipids in human tissue at the cellular and subcellular levels – as well as the associated inter-individual heterogeneity – had previously been inadequately characterised. These new findings could help us to better understand the course of the disease in future,” explains Prof. Dr Kristina Lorenz, Head of the Translational Research department at ISAS and one of the corresponding author.
The next step is to apply the method to tissue samples from patients with Fabry disease. The aim is to use such complementary methods to gain a better understanding of disease mechanisms in individual manifestations of Fabry disease – and, on this basis, to enable new approaches to diagnosis and treatment. In addition to Fabry disease, the focus is also on other conditions in which molecules undergo local changes within tissues, such as cardiovascular and metabolic diseases.
Original publication
Automatic Coregistration of High-Resolution MALDI-MSI and Raman Imaging Applied to Cardiac Tissue of Fabry Disease Mouse Models: https://pubs.acs.org/doi/10.1021/acs.analchem.5c07622.
Downloads
-
PDF (0.11MB)
Press release: Fabry Disease - a Molecular Map of Lipids in Tissue
-
PNG (0.33MB)
Overlay of images obtained using AP-MALDI-MSI (left) and Raman microscopy (centre) of heart cross-sections from mice
(The photo is available for editorial use exclusively exclusively for reporting on this subject. Credit: ISAS)
-
JPG (0.14MB)
Photograph of Jun.-Prof. Dr Sven Heiles
(The photo is available for editorial use exclusively for reporting on this subject. Credit: ISAS / Hannes Woidich)
-
JPG (1.94MB)
Photograph of Prof. Dr. Kristina Lorenz
(The photo is available for editorial use exclusively for reporting on this subject. Credit: ISAS)